New Study Shows Lawsuit Loans Are Most Popular In States With Highest Wealth Inequality
This article is a correlational study of the use of lawsuit loans and the factors listed below.
States With A Big Population That Are Disproportionally Represented
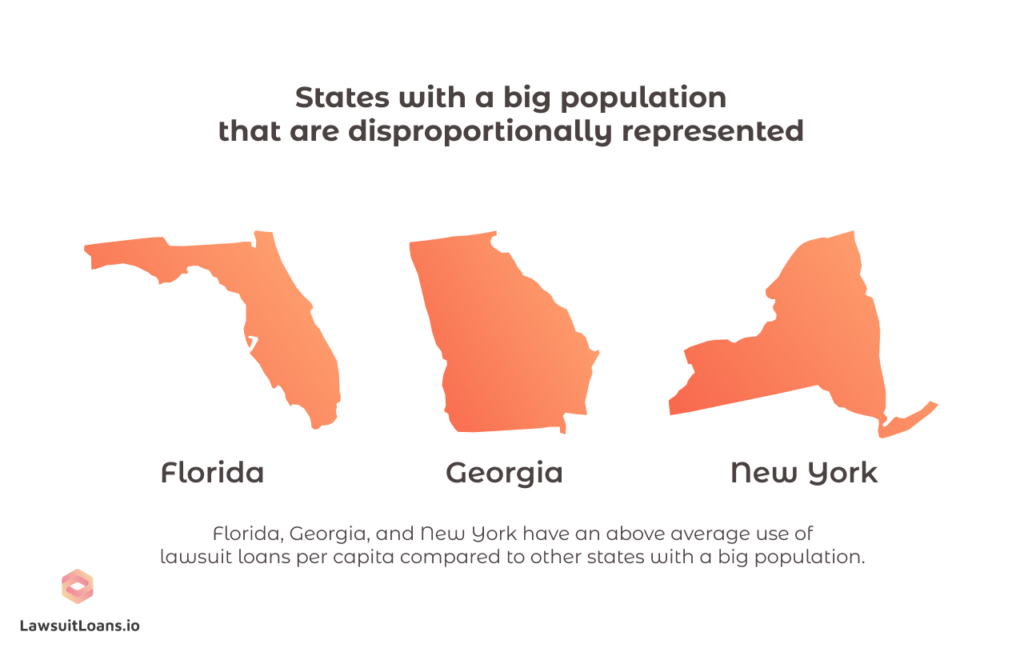
Florida, Georgia, and New York have an above average use of lawsuit loans per capita compared to other states with a big population.
States With A Big Population That Are Disproportionally Underrepresented
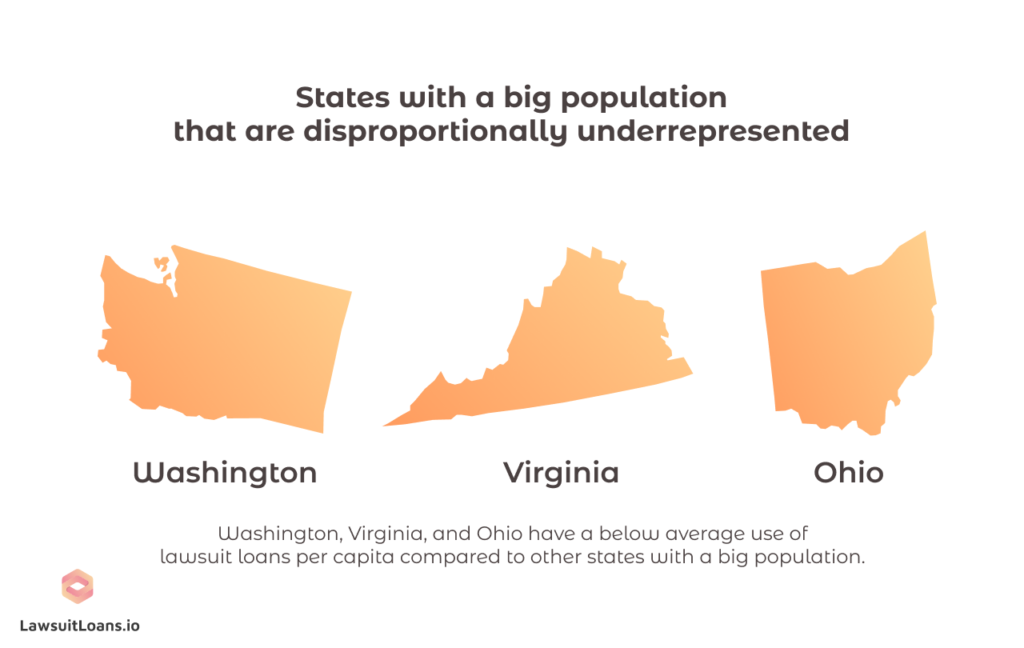
Washington, Virginia, and Ohio have a below average use of lawsuit loans per capita compared to other states with a big population.
Political Leaning
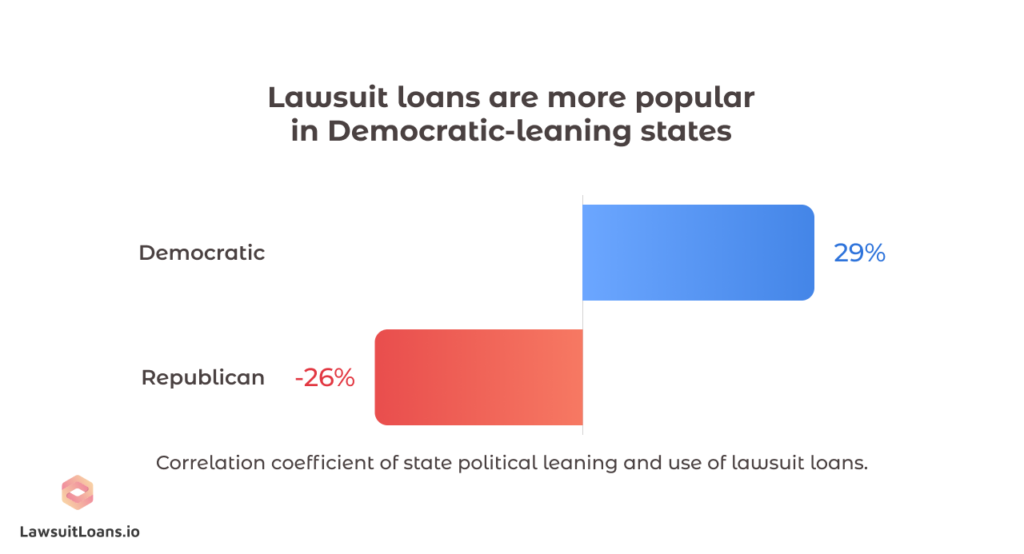
Consumers in states with an above average republican party affiliation are 85.8% more likely to rely on lawsuit loans.
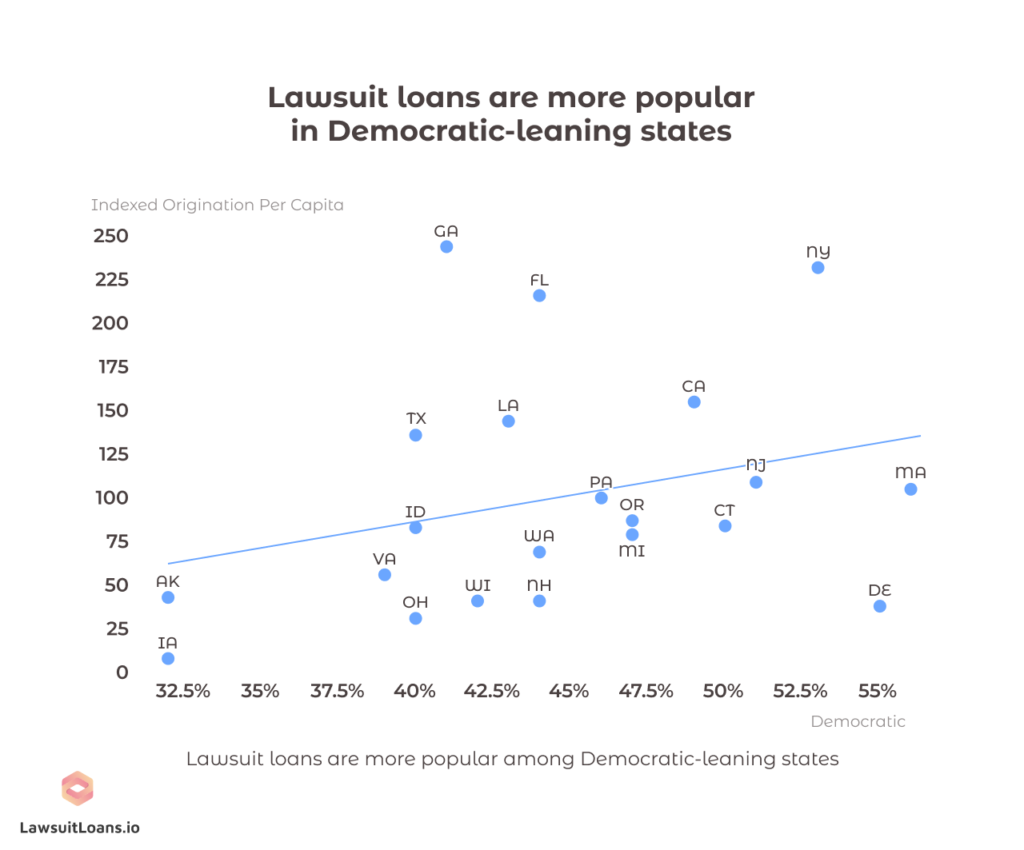
Consumers in states with a below average democratic party affiliation are 31% less likely to rely on lawsuit loans.
Educational Attainment
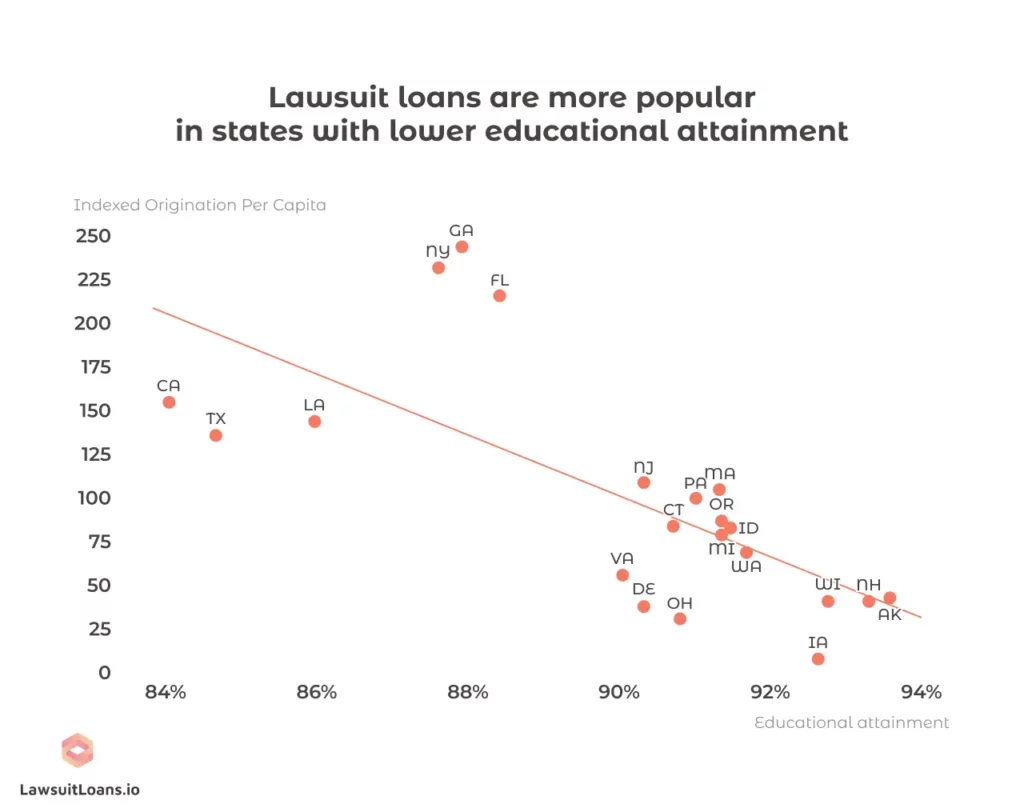
Consumers in states with below average educational attainment are 157.6% more likely to rely on lawsuit loans.
The greater the percentage of the population who graduate from high school, the less likely they are to get a lawsuit loan.
Poverty Rate
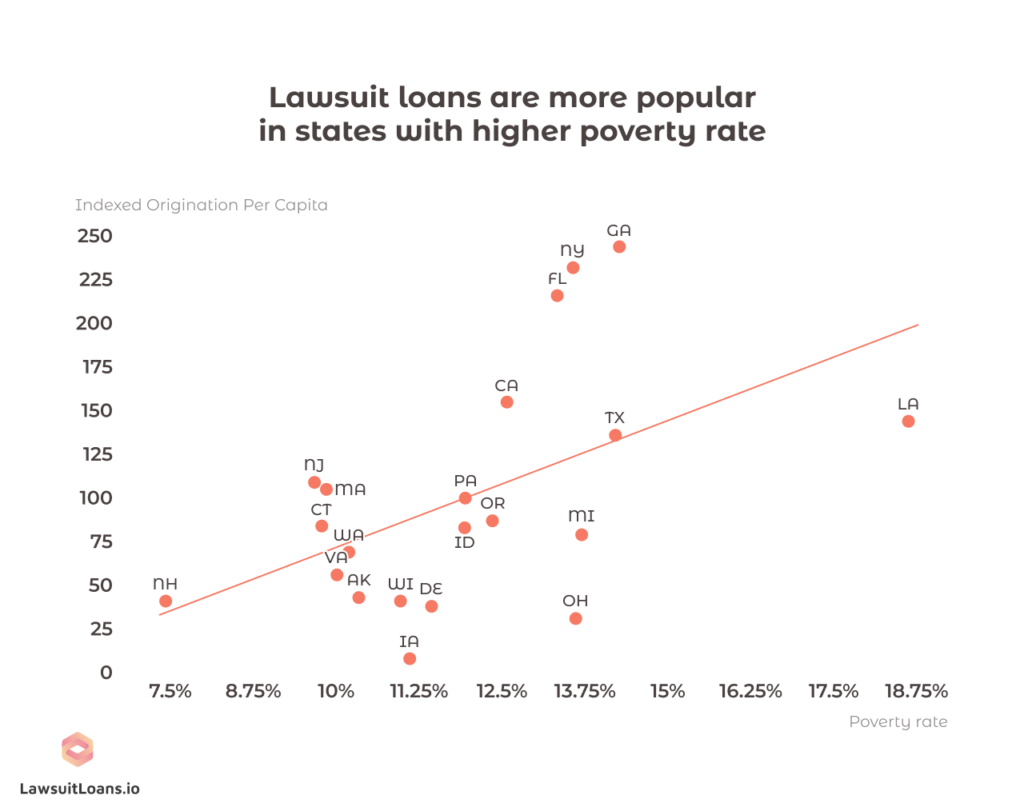
There is a correlation between the poverty rate and the use of lawsuit loans.
The greater the percentage of the population who lives under the national poverty rate, the more likely they are to get a lawsuit loan.
Income Inequality
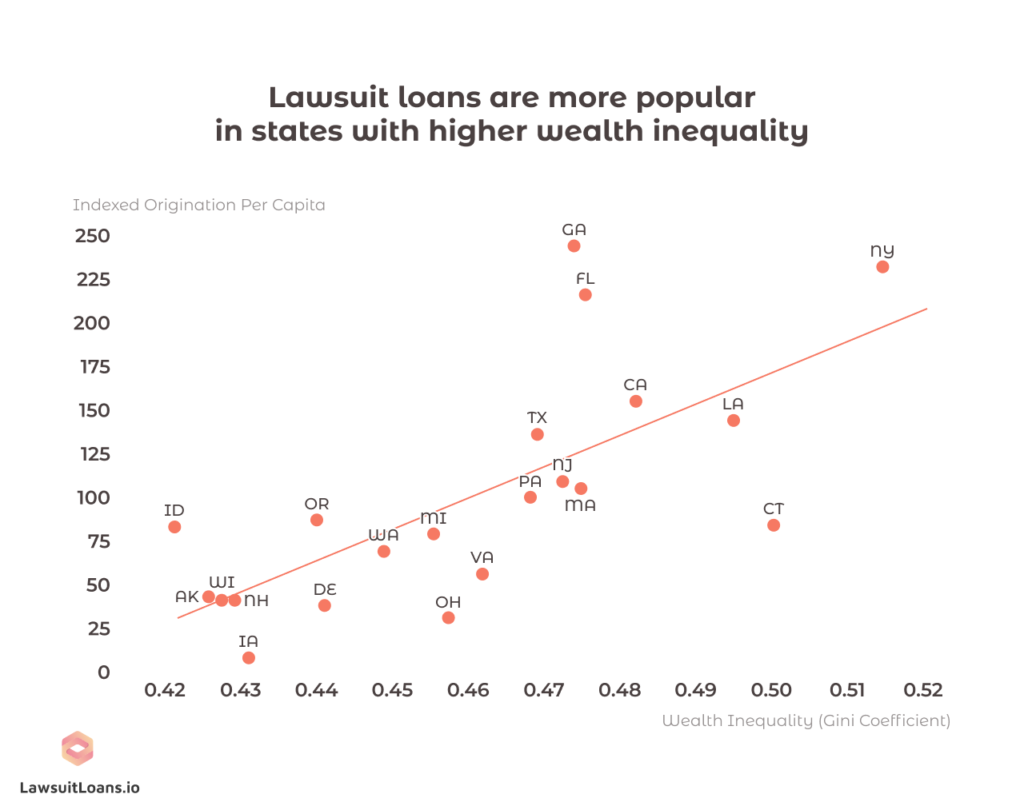
Income inequality has the strongest correlation of all of the data we looked at. Lawsuit loans are more popular in states with higher wealth inequality.
Consumers in states with above average income inequality are 52.3% more likely to rely on lawsuit loans.
It’s no coincidence then that Florida, Georgia, and New York are disproportionately overrepresented in how many lawsuit loans they take. These are three of the top ten states in the US with the highest income inequality.
We speculate that it is a “keeping up with the Joneses” story (i.e. people base their expenditure and expectations on what they see around them). Greater wealth disparity might imply that people who can’t afford it are trying to emulate folks that have a more costly lifestyle (and therefore need funding).
At first, this makes sense considering the strong correlation between wealth disparity and happiness.
Let’s say you’ve just been in an accident, and chances are good that you will get a settlement. You’re not wealthy, and now you’re injured. Those in your community (in your state) are much better off than you. It could take months or years to see your settlement, but you see others’ wealth displayed daily and feel bad because of it. A lawsuit loan is a fast and easy way to get the settlement money sooner rather than later, which means you don’t have to wait to buy that new gadget or shiny object you want.
However, when we looked at the data comparing the lawsuit funding rate among states and the rankings of happiest states in the United States, we found no correlation between the two.
Even so, there may still be a keeping up with the Joneses effect that we are seeing.
Cost of Living
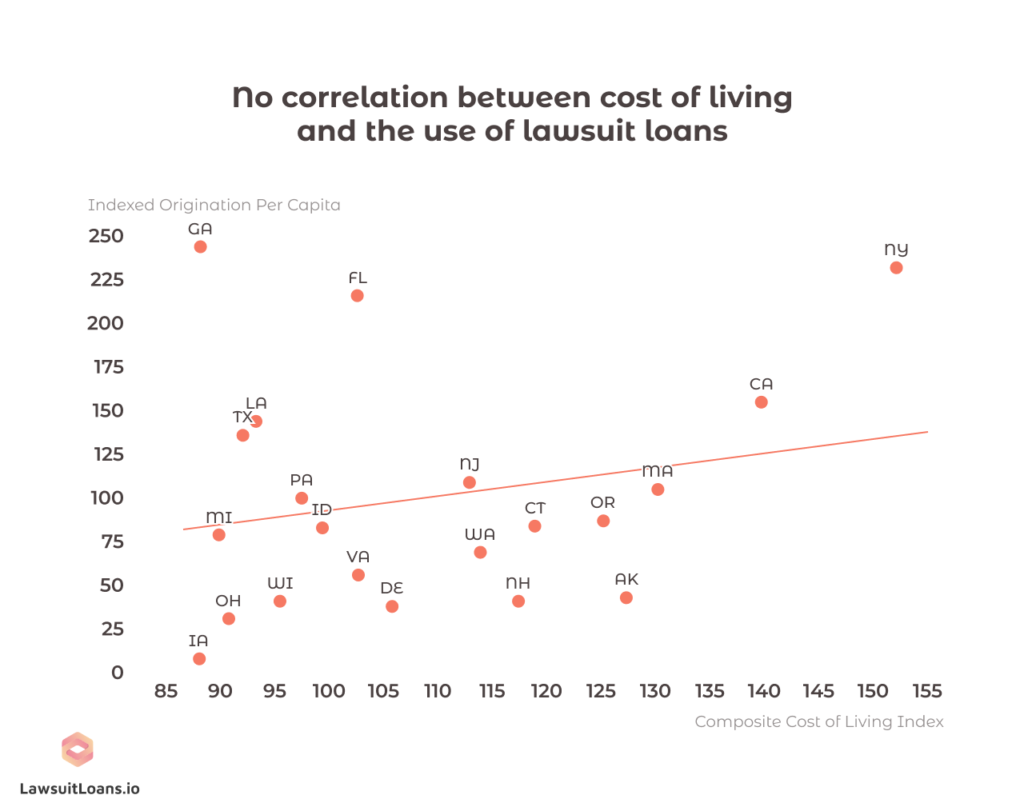
We found no correlation between the cost of living in a state and the use of lawsuit funding.
Race / Ethnicity – % Non-Hispanic White
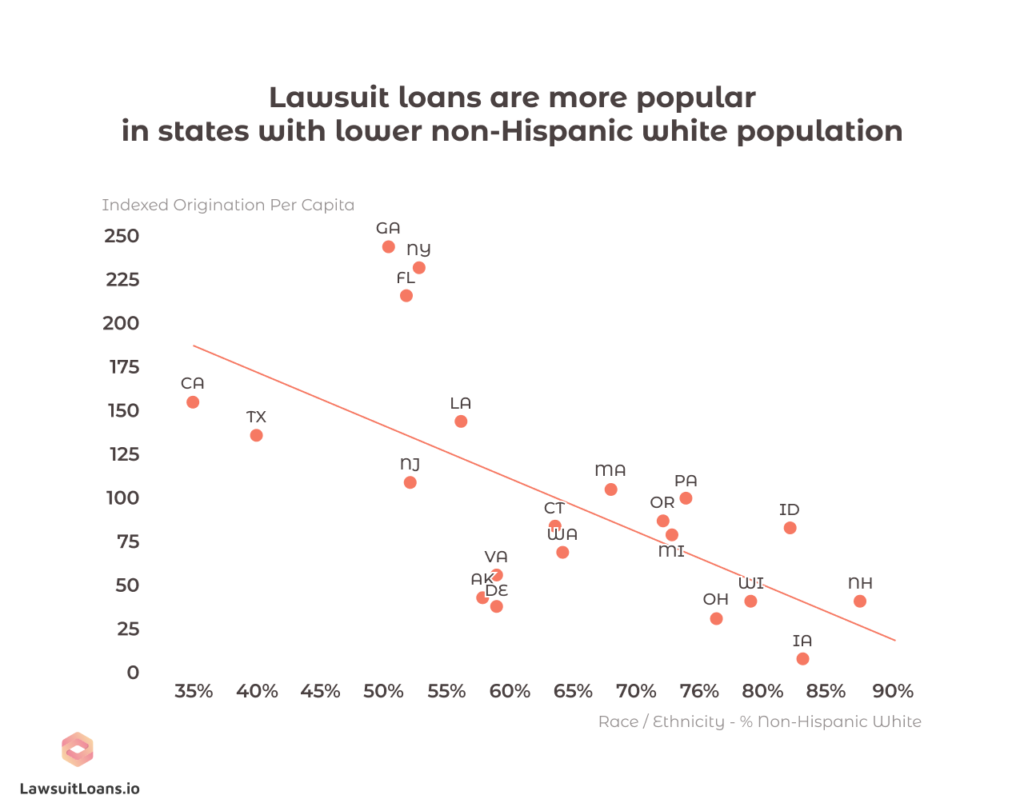
Consumers in states with a below average non-Hispanic white population are 24.8% more likely to rely on lawsuit loans.
Average IQ
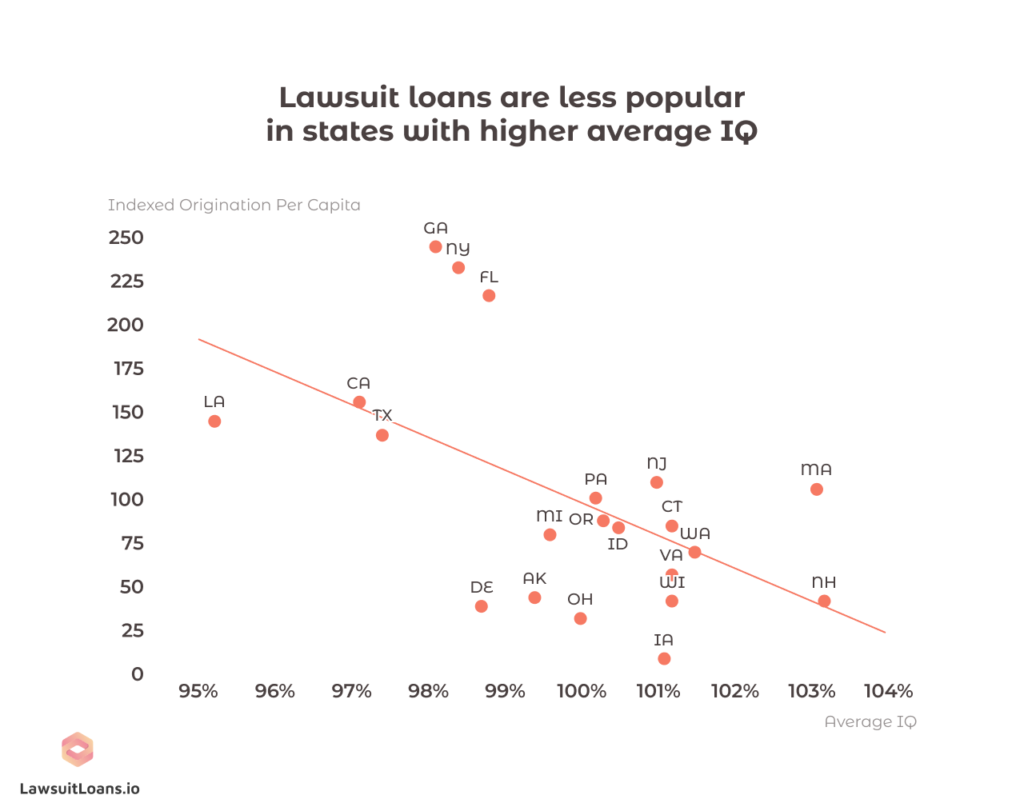
States with a population whose average IQ is higher are associated with lower use of funding.
Raccoons, Alligator, Opossum
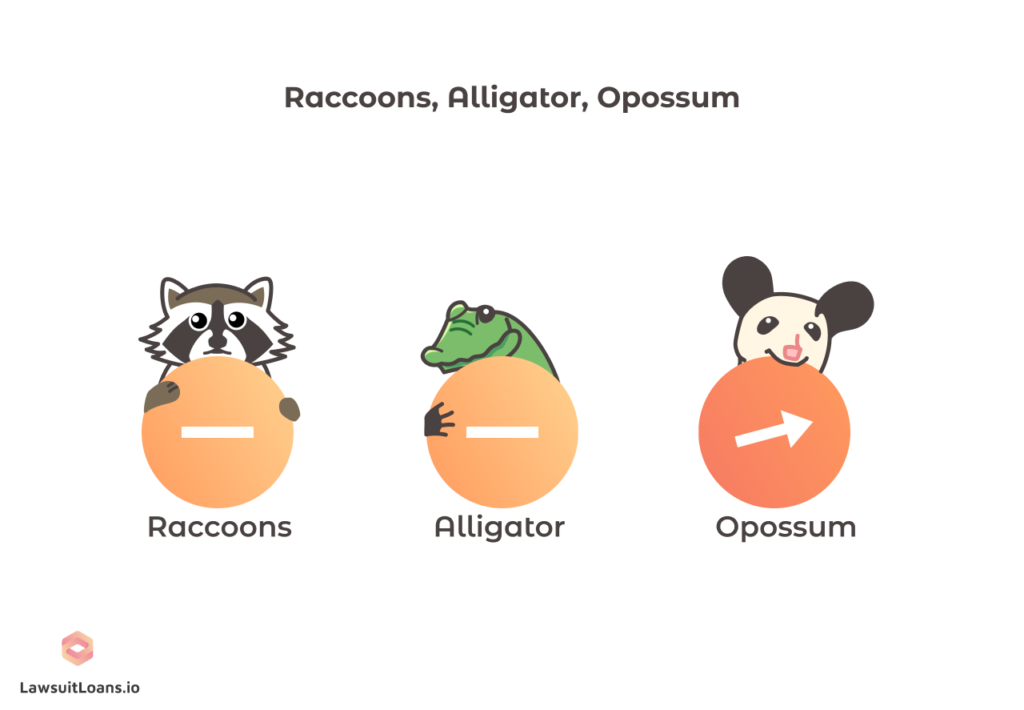
For fun, we decided to see if there was a correlation between states where raccoons, alligators, or opossums are legal to have as pets.
We found no correlation between states where raccoons or alligators are legal to have as pets.
Interestingly, we found a very weak negative correlation between states where opossums are legal and lawsuit funding.
Methodology
We ran a correlation and R-Squared analysis comparing proprietary loan origination data with the abovementioned factors.
We excluded states that had any regulation at any point during the five years we included in our research from 2016-2021.
Sources
- https://en.wikipedia.org/wiki/List_of_U.S._states_and_territories_by_population
- https://en.wikipedia.org/wiki/List_of_U.S._states_and_territories_by_educational_attainment
- https://en.wikipedia.org/wiki/List_of_U.S._states_and_territories_by_poverty_rate
- https://en.wikipedia.org/wiki/List_of_U.S._states_and_territories_by_income_inequality
- https://meric.mo.gov/data/cost-living-data-series
- https://www.pewresearch.org/religion/religious-landscape-study/compare/party-affiliation/by/state/
- https://en.wikipedia.org/wiki/List_of_U.S._states_by_non-Hispanic_white_population
- https://worldpopulationreview.com/state-rankings/pet-raccoon-legal-states
- https://worldpopulationreview.com/state-rankings/average-iq-by-state
- https://worldpopulationreview.com/state-rankings/pet-raccoon-legal-states
- https://worldpopulationreview.com/state-rankings/pet-raccoon-legal-states
Fair use statement
If you decide to share our content, please link back to this page so that other readers can see our full findings. Please use our work for noncommercial purposes only.